
How to run the 400m: workouts, race strategy and a training plan
By the Sprint University coaching team
A fast 400m takes top speed and the ability to hold as much of it as you can while you tire. In trained 400m runners about 41–45% of the race's energy comes from the aerobic system (the one that uses oxygen) and the rest from anaerobic sources (energy made without oxygen). Every runner slows in the last 100m. Elite runners hit top speed between 50 and 100m, and in the elite races in this guide the second 200m was 2–19% slower than the first.
Train it with five kinds of session spread over hard and easy days: speed, speed endurance, special endurance, lactate tolerance and tempo. In the race, run the first 200m fast but relaxed, a little slower than your 200m best, and fight to hold your speed from 200 to 300m.
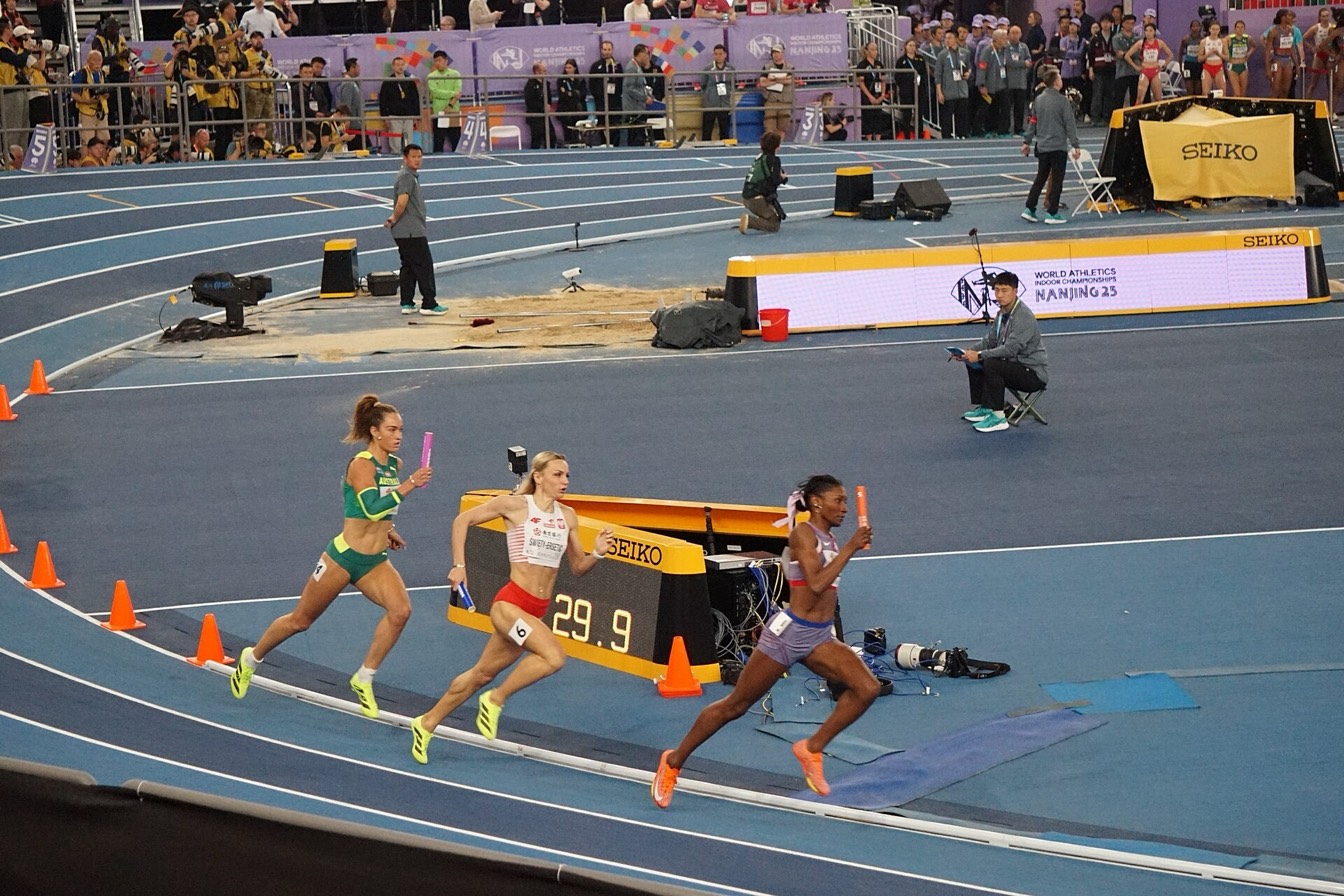
What limits 400m performance
The 400m sits between a sprint and a middle-distance race. Researchers who measured trained 400m runners in race-style time trials found the aerobic system supplied 41% of the energy in men and 45% in women, with the rest anaerobic. A treadmill study of national-level athletes put the 400m at 43% aerobic and found the aerobic system became the main energy source somewhere between 15 and 30 seconds in.
The anaerobic side shows up as lactate, a by-product that builds in your blood during hard efforts. In 17 top-level athletes tested within 10 minutes of major races, blood lactate after the race tracked how close each 400m was to the athlete's season best (r = 0.85 in men, 0.80 in women). On the track, 400m runners reached their peak oxygen uptake (how much oxygen the body is using), 94% of their maximum, after about 24 seconds or 192m. In the last 100m, oxygen uptake fell in every runner. The more acid had built up in a runner by 300m, the more they slowed over the final 100m.
Speed reserve
Your top speed sets the ceiling. In a study of seven competitive runners, two numbers predicted all-out speeds for efforts from 3 seconds to 4 minutes to within about 2.5% on a treadmill and 3.4% on the track. One was the fastest speed the runner could reach in a short burst. The other was the speed at which they hit their maximal oxygen uptake. The gap between those two speeds is often called the anaerobic speed reserve. The faster your top speed, the smaller a share of your max any 400m pace is.
Coaches also use two simple markers, set out by coach Pierre-Jean Vazel in the World Athletics report on the 2017 world championships:
- Speed endurance index. Your 400m time divided by your 200m best. Above about 2.16 you're a speed type (Wayde van Niekerk was 2.17). Below it you lean toward endurance (bronze medallist Abdalelah Haroun was 2.09). The index had no link to 400m time, so both types can be world class.
- Speed reserve in the race. Your 200m split during the 400m minus your 200m best. For men under 45 seconds it averaged 0.84 seconds. Runners who reached halfway closer to their 200m best slowed more in the second half.
A speed type usually needs more special endurance. An endurance type usually gains most from getting faster over 100m and 200m. Check your times against the average 400m times and, for younger athletes, the 400m times by age.
400m splits in elite races
The second 100m, on the back straight with a running start, is the fastest of the race. The last 100m is always the slowest. These 100m splits come from World Athletics biomechanics reports. The women's 100m segments are worked out from the in-race times in the women's report.
| Race | Time | 0–100 | 100–200 | 200–300 | 300–400 | 200m split |
|---|---|---|---|---|---|---|
| Wayde van Niekerk, Rio 2016 (WR) | 43.03 | 10.77 | 9.81 | 10.48 | 11.97 | 20.58 |
| Wayde van Niekerk, London 2017 | 43.98 | 10.85 | 9.93 | 10.86 | 12.34 | 20.78 |
| Abdalelah Haroun, London 2017 | 44.48 | 11.26 | 10.33 | 11.06 | 11.83 | 21.59 |
| Butch Reynolds, Zurich 1988 | 43.29 | 11.3 | 10.1 | 10.7 | 11.2 | 21.4 |
| Allyson Felix, Beijing 2015 | 49.26 | 11.46 | 11.88 | 12.33 | 13.59 | 23.34 |
| Shaunae Miller-Uibo, Rio 2016 | 49.44 | 11.80 | 11.18 | 12.36 | 14.10 | 22.98 |
A few things stand out:
- Van Niekerk's world record had the fastest second 100m (9.81) and the fourth-fastest third 100m (10.48) of all the personal-best races the report's commentary had analysed. Most of his gains over the years came in the second half, especially from 200 to 300m.
- Haroun was last at 340m in the 2017 final and finished third. He ran the slowest first half of the finalists and was the only one under 12 seconds for the last 100m.
- In 2017, Allyson Felix and Shaunae Miller-Uibo both passed 200m in under 23 seconds and finished third and fourth. Phyllis Francis won in 49.92, splitting 23.11 (not counting reaction time) and 26.61.
- The report's commentary ties the final result more to holding speed from 200 to 300m than to the last 100m, where runners at every level slow at about the same rate.
A study that compared world-class, national and regional 400m runners found everyone hit peak speed between 50 and 100m. World-class men passed 200m at 97.6% of their 200m-best speed and world-class women at 96.3%, faster than the lower-level groups. The world-class runners also slowed more: their fatigue index (how much they slowed from peak speed) was 23%, against 14% for national and regional runners.
400m pace chart
In the elite races above, the second 200m was 2–12% slower than the first for the men and 11–19% slower for the women. The chart turns a goal time into first and second 200m splits at three levels of slowdown. If you're new to the event, start with the 10% column and adjust once you see how your last 100m holds up.
| Goal 400m | 2nd 200 6% slower | 2nd 200 10% slower | 2nd 200 14% slower |
|---|---|---|---|
| 45.0 | 21.8 / 23.2 | 21.4 / 23.6 | 21.0 / 24.0 |
| 48.0 | 23.3 / 24.7 | 22.9 / 25.1 | 22.4 / 25.6 |
| 50.0 | 24.3 / 25.7 | 23.8 / 26.2 | 23.4 / 26.6 |
| 52.0 | 25.2 / 26.8 | 24.8 / 27.2 | 24.3 / 27.7 |
| 55.0 | 26.7 / 28.3 | 26.2 / 28.8 | 25.7 / 29.3 |
| 58.0 | 28.2 / 29.8 | 27.6 / 30.4 | 27.1 / 30.9 |
| 60.0 | 29.1 / 30.9 | 28.6 / 31.4 | 28.0 / 32.0 |
| 65.0 | 31.6 / 33.4 | 31.0 / 34.0 | 30.4 / 34.6 |
| 70.0 | 34.0 / 36.0 | 33.3 / 36.7 | 32.7 / 37.3 |
Check your first 200m against your 200m best too. Within a few tenths of it and you'll pay in the home straight. The track time converter helps when your best times come from different distances.
400m race strategy, 100m by 100m
0–100m: get out hard
Accelerate out of the blocks like you would in a 200m. Peak speed comes between 50 and 100m. An analysis cited in the World Athletics report found 400m runners can reach 90% of their 100m top speed as early as 5.5 seconds into the race. The block start guide covers the setup.
100–200m: relax at speed
Come off the bend and carry your speed down the back straight without forcing it. This is the fastest 100m of the race for elite runners, and it should feel smooth: tall posture, loose shoulders and hands. Aim to reach 200m slower than your 200m best, close to your split from the pace chart.
200–300m: hold your speed
Most races are decided here. Your oxygen uptake has already peaked, fatigue is building, and the runners who keep their speed through the second bend usually run the best times. Keep driving your arms and stay on the inside of your lane.
300–400m: hold your form
Everyone slows. In trained runners racing to an elite pacing pattern, the slowest speed in the last 100m was 77% of their peak speed. Step rate (steps per second) drops more than step length: at 350m in London, van Niekerk's step rate was 3.33 per second, against 4.00 at 150m of his 200m. Don't reach for longer steps. Keep your arms moving, stay tall, and let your feet land under you. The overstriding guide explains why reaching slows you down.
The Sprint University app
Speed work every week, planned around your meets
Sprint University schedules your high and low days and places the lifting. Tell the coach chat about a meet, a missed day or sore legs and it redrafts the week.
Get Sprint UniversityThe five types of 400m workout
Coaches don't agree on the names, so one coach's speed endurance session is another's special endurance. This table lists the common types from shortest to longest. The speed, speed endurance, sprint-specific endurance and extensive tempo rows come from a review of elite sprint training, where intensity is a percentage of top speed. The special endurance and intensive tempo rows come from Sprint University's 400m coaching notes.
| Type | Distance | Intensity | Rest | Session volume |
|---|---|---|---|---|
| Speed: acceleration | 10–50m | >98% | 2–7 min | 100–300m |
| Speed: max velocity | 10–30m flying | >98% | 4–15 min | 50–150m |
| Speed endurance | 60–80m | 90–95% | 2–4 min (8–15 between sets) | 600–2,000m |
| Sprint-specific endurance | 80–150m | >95% | 8–30 min | 300–900m |
| Special endurance I | 150–300m | 90–95% | 10–15 min | 300–900m |
| Special endurance II (lactate tolerance) | 300–600m | 85–95% | 15–20+ min | 300–1,200m |
| Intensive tempo | 150–400m | 80–89% | 2–4 min | 800–1,800m |
| Extensive tempo | 100–300m | 60–70% | 1–3 min | 1,000–2,000m |
Speed
Short acceleration and flying sprints at full effort with full rest. They raise the top speed that everything else in your 400m depends on. Keep them in all year, race weeks included. The sprint workouts guide has seven of these sessions written out.
Speed endurance
Sprints of 60–150m that train you to hold speed as you start to slow. The elite review describes sprint-specific endurance as runs of 7–15 seconds at 95–100% with full recovery. It gives a coaches' rule of thumb of 1–2 minutes of rest for every second of all-out sprinting.
Special endurance
Reps of 150–300m at 90–95% with 10–15 minutes of rest. This is the work closest to the race: fast enough to feel like it and long enough to build second-half fatigue.
Lactate tolerance
Special endurance II: reps of 300–600m at 85–95% with 15–20 minutes or more of rest. These are the hardest sessions a 400m runner does. Save them for experienced athletes and space them out.
Tempo
Extensive (easy) tempo runs at 60–70% and fills the easy days. Intensive (harder) tempo runs at 80–89% on short rest and counts as a hard day. The tempo runs guide gives paces and sample sessions for both.
To turn a percentage into a target time, divide your best time for the rep distance by the percentage, as in the tempo runs guide. A runner with a 36.0 best for 300m runs 95% reps in about 37.9 seconds.
Sample 400m workouts
The first two sessions come from Sprint University's base program. The flying 20s are a speed day. The speed endurance day runs full-speed 40s and 60s, then finishes with tempo.
| Block | Prescription |
|---|---|
| Track warm-up | 15 min: easy jog, dynamic drills, build-ups |
| 10m sprints | 3 × 10m @ 98–100%, rest 2 min |
| 30m sprints | 2 × 30m @ 98–100%, rest 3 min |
| Flying 20m | 4 × flying 20m with a 20m run-in @ 100%, rest 5 min |
| Backward run | 2 × 60m, walk-back rest |
| Barefoot cooldown walk | One easy lap of the track barefoot, unhurried |
Film the flying 20s.
| Block | Prescription |
|---|---|
| Track warm-up | 15 min: easy jog, dynamic drills, build-ups |
| 10m sprints | 2 × 10m @ 98–100%, rest 2 min |
| 40m sprints | 3 × 40m @ 100%, rest 4 min |
| 60m sprints | 3 × 60m @ 100%, rest 6 min |
| 150m tempo runs | 4 × 150m @ 75%, rest 4 min |
| Backward run | 2 × 60m, walk-back rest |
| Barefoot cooldown walk | One easy lap of the track barefoot, unhurried |
Next is the sprint-specific endurance dose the elite review gives for a well-trained sprinter. It suits a 400m runner early in the season, before the longer reps.
| Block | Prescription |
|---|---|
| Track warm-up | 15 min: easy jog, dynamic drills, build-ups |
| 150m sprints | 4–6 × 150m @ 95–100%, rest 20–30 min |
| Cooldown | 10 min easy jog or walk |
The elite dose from a review of elite sprint training. A younger or less trained athlete might run 2–3 × 100m with 10 min rest.
Special endurance I, the long reps closest to the race:
| Block | Prescription |
|---|---|
| Track warm-up | 15 min: easy jog, dynamic drills, build-ups |
| 300m reps | 2 × 300m @ 95%, rest 15 min |
| Cooldown | 10 min easy jog or walk |
From Sprint University's 400m coaching notes.
Lactate tolerance. Run the 500m controlled, rest fully and run the 300m all-out:
| Block | Prescription |
|---|---|
| Track warm-up | 15 min: easy jog, dynamic drills, build-ups |
| 500m | 1 × 500m @ 90% |
| Recovery | 20 min, walking and staying warm |
| 300m | 1 × 300m @ 100% |
| Cooldown | 10 min easy jog or walk |
From Sprint University's 400m coaching notes, which allow it no more than once every 10–14 days. Not for beginners.
Split runs break the race into halves with a short rest, so you run goal pace and then finish tired. They're a staple of the peaking phase, the last weeks before your big races:
| Block | Prescription |
|---|---|
| Track warm-up | 15 min: easy jog, dynamic drills, build-ups |
| Split 400s | 3 × (200m at goal 400m pace, 60 s rest, 200m all-out), about 10 min between sets |
| Cooldown | 10 min easy jog or walk |
From Sprint University's 400m coaching notes. Shorten the rest inside each set from 60 s to 45 s, then 30 s, as the season goes on.
400m training plan: sample weeks
Put easy days between hard days. The elite review allows 48–72 hours after speed endurance or sprint-specific endurance before the next hard session, and 24 hours after tempo. It also notes that long-sprint specialists usually go long to short: longer runs early in preparation, getting shorter and faster through the year. The periodization for sprinters guide covers how the phases of the season fit together.
Pre-season week
An example from the middle of preparation. Volume is higher. The special endurance day starts with intensive tempo and moves to faster reps with longer rest as the block goes on.
| Day | Session | Type of day |
|---|---|---|
| Mon | Speed: 4 × 30m accelerations and 3 × flying 20m, then lift | High |
| Tue | Extensive tempo: 10 × 100m at 65–70%, walk back | Low |
| Wed | Intensive tempo early in the block (6 × 200m at 85%, 2 min rest), special endurance I later | High |
| Thu | Extensive tempo or rest | Low |
| Fri | Speed endurance: 2 sets of 5 × 60m at 90–95%, then lift | High |
| Sat | Extensive tempo: 2 sets of 6 × 150m at 65–70% | Low |
| Sun | Rest | Low |
In-season week
An example with a Saturday meet. The hardest training day is furthest from the race, and speed stays in midweek at low volume.
| Day | Session | Type of day |
|---|---|---|
| Mon | Special endurance: 2 × 300m at 95%, or split runs | High |
| Tue | Extensive tempo, about 1,000m at 60–70% | Low |
| Wed | Speed: 3 × 30m from blocks and 3 × flying 20m, short lift | High |
| Thu | Easy tempo or mobility | Low |
| Fri | Rest, or 3–4 sharp starts | Low |
| Sat | Meet | High |
| Sun | Rest | Low |
Lift on the speed days, after the running. Every third or fourth week, cut volume to recover. The deload week guide shows what to trim. Warm up the same way before every hard session with the sprint warm-up.
Common mistakes
- Going out at 200m race effort
- Reach halfway a little slower than your 200m best. Elite men who ran the first half closer to their 200m best slowed more in the second.
- Dropping speed work
- Your top speed sets your speed reserve. Keep short acceleration and flying sprints in every week, in season too.
- Training like a distance runner
- Get your aerobic work from tempo on the track and keep the hard days fast. Long slow runs train a much slower speed than you race at.
- Lactate tolerance every week
- Special endurance II is the hardest session you'll run. Space it 10–14 days apart and keep the rest of the week lighter around it.
- Cutting the rest on special endurance
- Reps of 150–300m need 10–15 minutes of rest. Short rest turns a race-pace session into a slow one.
- Reaching for longer steps in the straight
- Step rate drops the most when you tire. Keep your arms driving and your feet landing under you.
The Sprint University app
A sprint week built from your current times
Sprint University programs acceleration, top speed, speed endurance, plyos and strength week by week from your current times. Tell the coach chat about a meet, a missed day or sore legs and it redrafts the week.
Get Sprint UniversityFAQ
More guides
- How to Be More ExplosiveRate of force development explained, the lifts and jumps that raise it, and a sample week.
- Does Muscle Make You Slower?Strength vs speed: why force per kilogram sets top speed, how elite sprinters are built and the lifting that transfers.
- Fast Twitch vs Slow Twitch FibersType I, IIa and IIx fibers, why humans don't have IIb, a champion sprinter's fiber mix and what training can change.
- Periodization for SprintersMacrocycles, mesocycles and microcycles, indoor and outdoor peaks, what the research shows and how to taper.
- Sprint WorkoutsAcceleration, top-speed, tempo and speed-endurance sessions written out with sets, reps and rest.
- Hill SprintsWhat uphill sprints train, how steep and how far for each goal, hill sprint workouts and why to be careful downhill.
Sources
- Duffield R, Dawson B, Goodman C. Energy system contribution to 400-metre and 800-metre track running. Journal of Sports Sciences, 2005.
- Spencer MR, Gastin PB. Energy system contribution during 200- to 1500-m running in highly trained athletes. Medicine & Science in Sports & Exercise, 2001.
- Lacour JR, Bouvat E, Barthélémy JC. Post-competition blood lactate concentrations as indicators of anaerobic energy expenditure during 400-m and 800-m races. European Journal of Applied Physiology, 1990.
- Hanon C, Lepretre PM, Bishop D, Thomas C. Oxygen uptake and blood metabolic responses to a 400-m run. European Journal of Applied Physiology, 2010.
- Hanon C, Thomas C. Effects of optimal pacing strategies for 400-, 800-, and 1500-m races on the VO2 response. Journal of Sports Sciences, 2011.
- Bundle MW, Hoyt RW, Weyand PG. High-speed running performance: a new approach to assessment and prediction. Journal of Applied Physiology, 2003.
- Hanon C, Gajer B. Velocity and stride parameters of world-class 400-meter athletes compared with less experienced runners. Journal of Strength and Conditioning Research, 2009.
- Pollitt L, Walker J, Tucker C, Bissas A. Biomechanical Report for the IAAF World Championships London 2017: 400 m Men's. IAAF (World Athletics), with coaching commentary by Pierre-Jean Vazel and Ralph Mouchbahani.
- Pollitt L, Walker J, Tucker C, Bissas A. Biomechanical Report for the IAAF World Championships London 2017: 400 m Women's. IAAF (World Athletics), with coaching commentary by Pierre-Jean Vazel.
- Haugen T, Seiler S, Sandbakk Ø, Tønnessen E. The Training and Development of Elite Sprint Performance: an Integration of Scientific and Best Practice Literature. Sports Medicine – Open, 2019.